01
The store, the ad platform and the dashboard all disagree
Each one reports its own version of the day, and none of them shows the working behind its figure.
Revenue Intelligence for DTC and subscription brands
Every morning we read the e-commerce tools your team already runs, compute every figure in code, and have AI explain what moved and why. Every number opens to the records behind it.
The first 30 days are free, and we take no card.
A morning every operator knows
Your team spends the morning reconciling reports while ad spend keeps running. By the time everyone agrees on the number, the day to act on it has gone.
01
Each one reports its own version of the day, and none of them shows the working behind its figure.
02
They export, reconcile and argue about which figure to trust. Nobody decides anything until they agree.
03
Ask a chatbot why revenue fell and it answers confidently from figures it cannot check. Your team acts on it anyway.
The brief
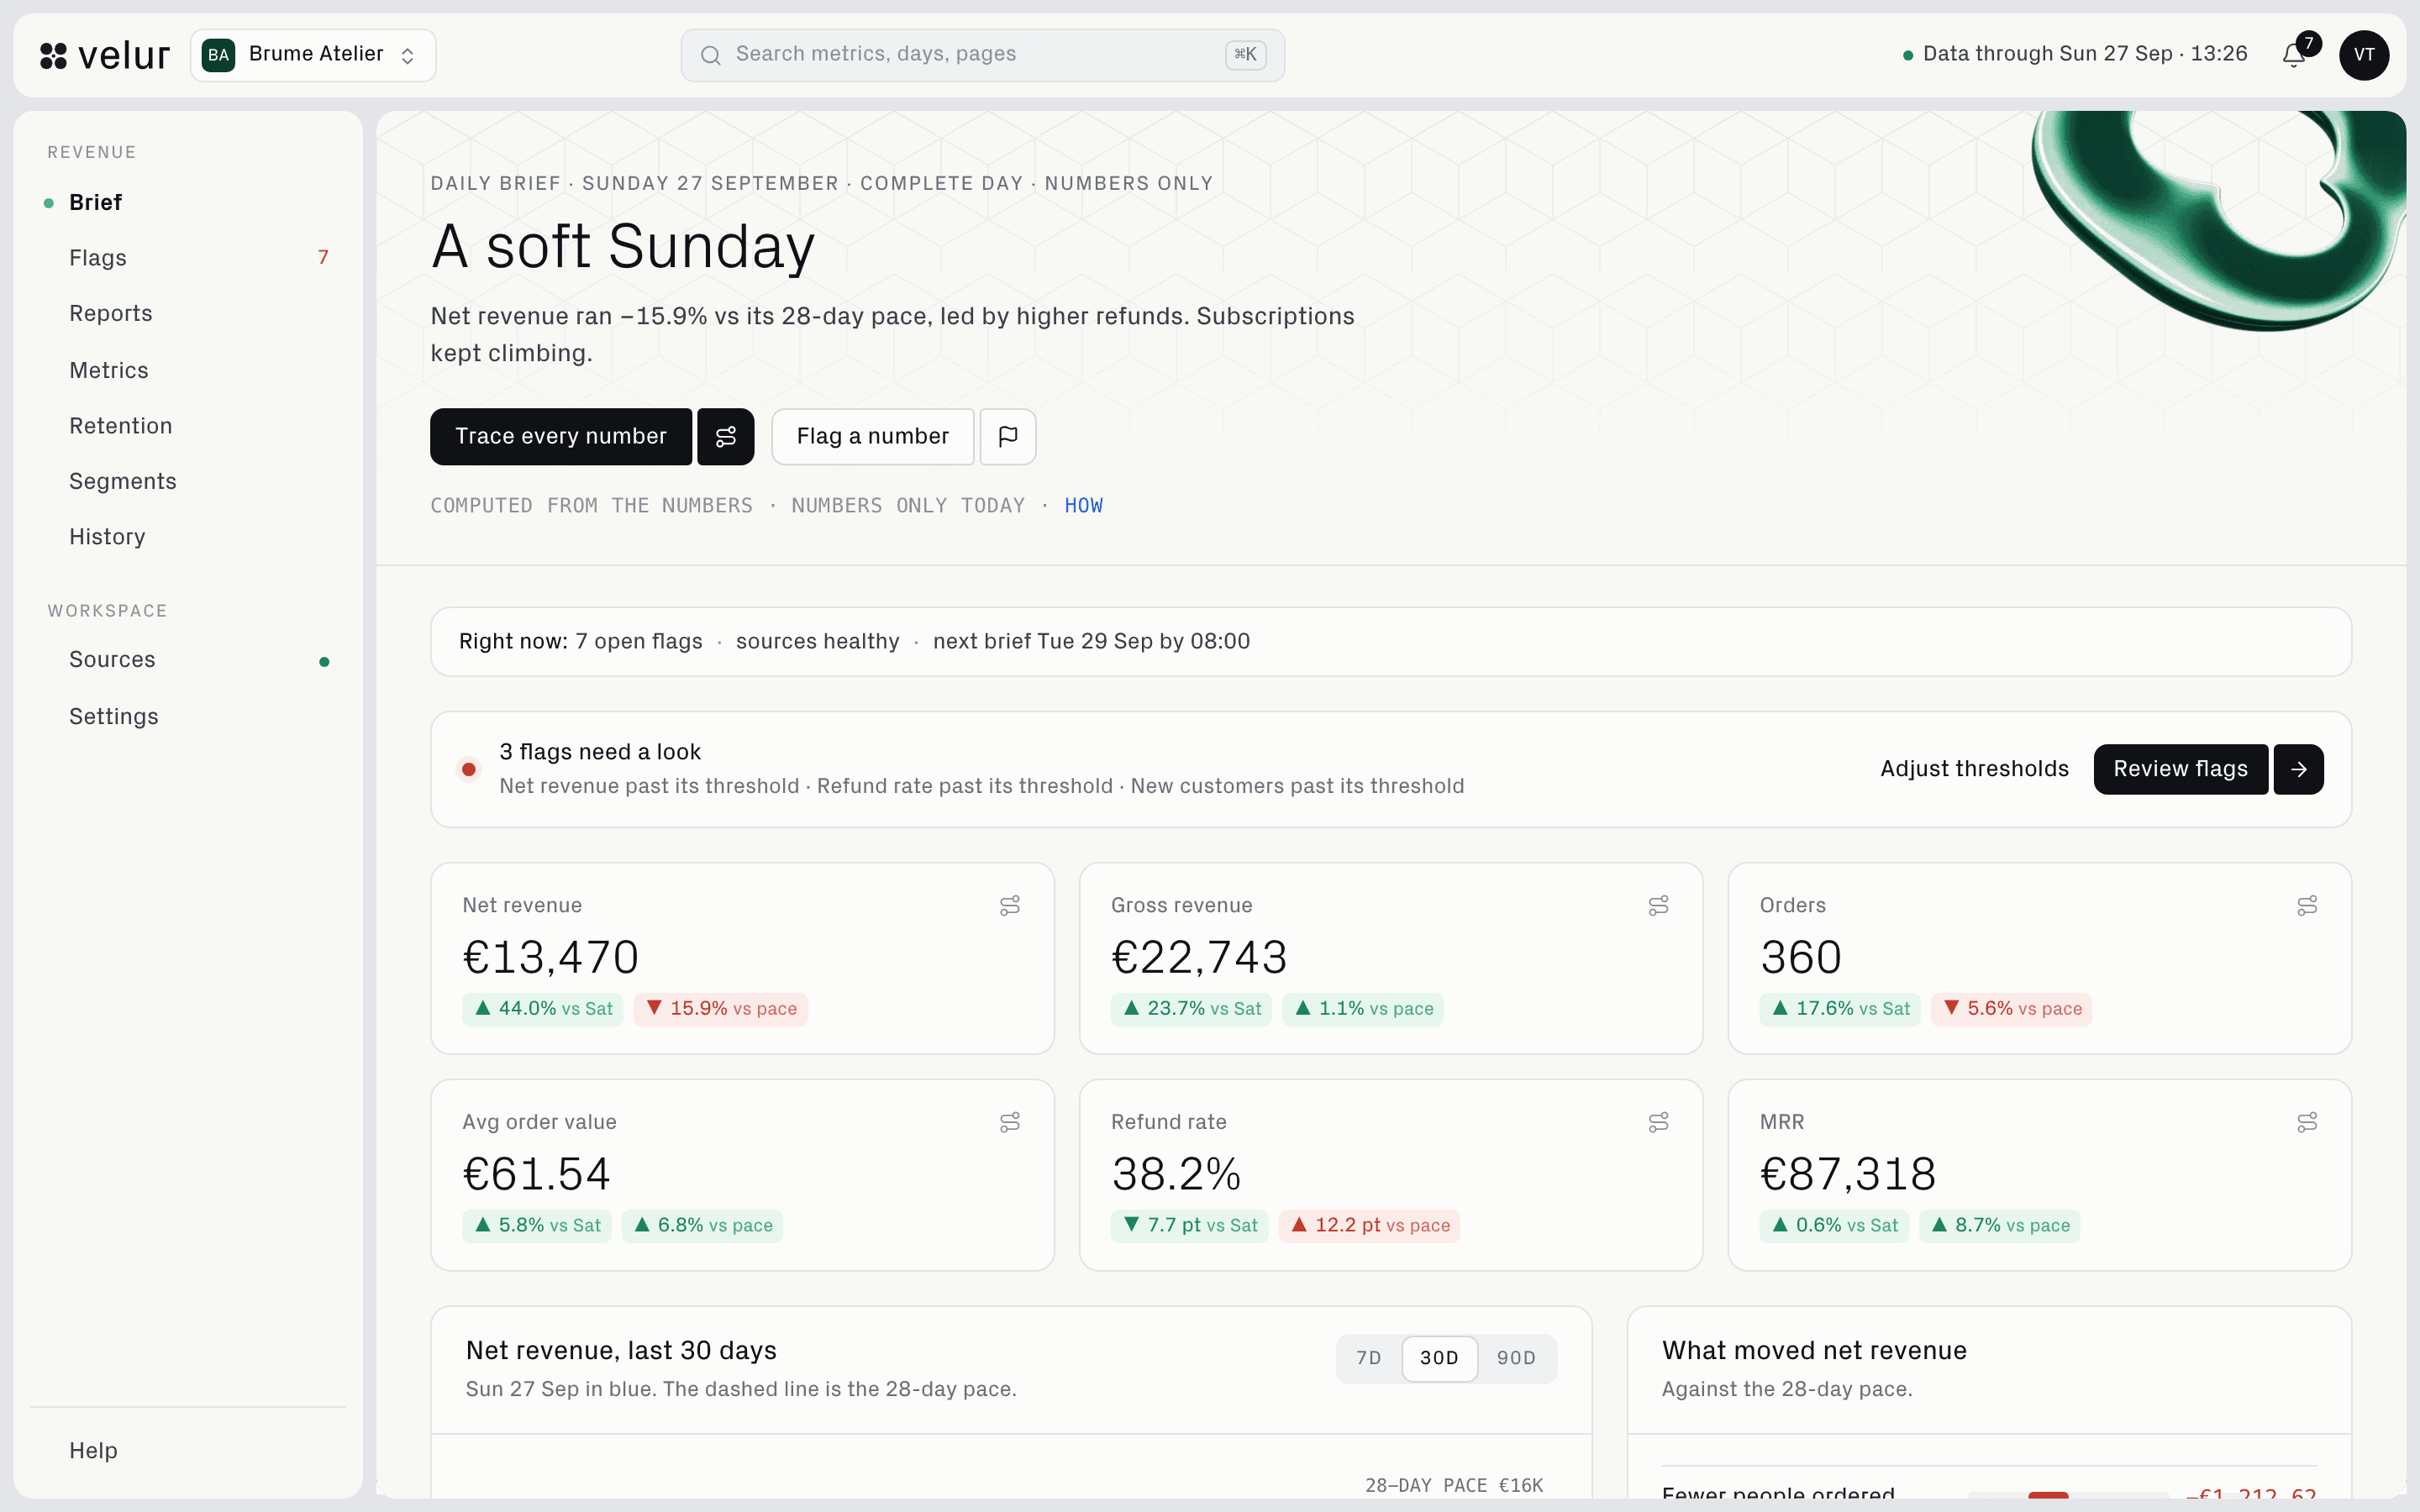
It covers the eleven figures we compute in code, and AI says in plain words what moved them. Every figure links to its trace: the formula, the stored inputs and the sync it came from.
In the inbox
A strong Monday: net revenue ran 14.2% above its 28-day pace on more orders and a fuller basket. Nothing crossed a threshold.
Read from your sources, recomputed from raw rows, sent once every source reported. Nothing estimated.
How the day opens
One sentence on how the day went, written from the figures.
The line after it says what moved and why.
The eleven figures
Gross revenue · Net revenue · Orders · Average order value · Refunds · Refund rate · New customers · Repeat customer rate · MRR · Ad spend · Blended ROAS
Each one is measured against its own trailing 28-day pace.
What to watch
No flags today: every metric inside its usual range.
Flags come from fixed rules, with no score behind them. A figure halfway to its threshold is named as worth watching.
In the console
The brief
The email covers the day that just closed, so every figure in it is final.
Metrics
Open a figure and you get the arithmetic in words, what the day was compared with, and the trace id that records the check.
Flags
You set the threshold. When a day crosses it, the brief names the rule that fired and the figure that crossed it.
Reports
Each one is assembled from days we have already computed, so a report and the brief can never disagree with each other.
Retention
Cohorts come from the same orders as every other figure, so retention and revenue tie out.
Every morning
Each one is answered from your own records, and each answer says which part of the console it comes from.
What did revenue do yesterday, and why?
The brief opens with it: net revenue against its own trailing 28-day pace, and the line that says what moved it.
Where will the month land?
Reports pace the month against the target you set, built from days we have already computed, so the pace and the brief never disagree.
Did a day fail to hold?
Flags name the rule that fired and the figure that crossed the threshold your workspace set.
Why Velur
More operators now hand their morning analysis to AI, and that only works when the figures underneath can be checked. We compute every figure in code and let AI explain it. We also connect read-only, so Velur cannot place an order, issue a refund or change a setting.
How we handle your dataComputed in code
Every one of the eleven figures is computed from your own records, so the same inputs always give the same number.
Explained by AI
The model reads the finished figures and writes what moved them. It never computes a number.
Checkable
Open a figure and see the formula that ran, the inputs it read and the trace id that records the check.
Founding brands get the whole product free for 30 days, with no card. See what the plan includes


